








Executive Summary
Overall Equipment Effectiveness (OEE) is the most widely adopted measure of manufacturing performance globally — and one of the most consistently misapplied in Indian manufacturing environments.
Based on Micraft's observations across 500+ manufacturing implementations spanning automotive, engineering, pharmaceutical, and general manufacturing sectors, this paper presents three central findings:
Finding 1 — The OEE Measurement Gap is Larger Than Most Manufacturers Recognise Manufacturers relying on manually compiled OEE data consistently report figures 8 to 15 percentage points higher than the actual OEE measured when real-time, at-source data capture is implemented. This gap is not explained by dishonesty but by the structural limitations of manual recording — short stoppages not captured, performance losses underestimated, and quality rework excluded from quality OEE calculations.
Finding 2 — The Six Big Losses Are Not Equally Distributed Analysis of OEE loss patterns across Micraft MES implementations reveals that for the majority of Indian discrete manufacturers, two loss categories — unplanned downtime and minor stoppages — account for 60 to 70% of total OEE losses. This concentration means that improvement initiatives focused on these two categories deliver the majority of achievable OEE improvement.
Finding 3 — Deployment Speed Is the Critical Variable in MES ROI The difference between an MES that delivers measurable OEE improvement within 6 months and one that delivers marginal results over 18 months is almost never the feature set of the product. It is whether the system went live quickly enough, with sufficient operator adoption, to generate the measurement accuracy needed for meaningful improvement analysis.
This white paper examines the OEE measurement problem in Indian manufacturing, presents a framework for understanding where production losses actually occur, and describes the operational and technical conditions required for OEE improvement programmes to deliver sustainable results.
1. The State of OEE Measurement in Indian Manufacturing
1.1 The Adoption of OEE as a Manufacturing KPI OEE has been a standard manufacturing performance metric since its formalisation in the context of Total Productive Maintenance (TPM) methodology in the 1980s. Its adoption in Indian manufacturing has accelerated significantly over the past decade, driven by three factors: the expansion of automotive and engineering export-oriented manufacturing with customer-mandated performance metrics; the growth of Lean Manufacturing implementation programmes; and the increasing availability of affordable production monitoring technology.
Today, OEE is referenced in the performance review of the majority of Indian manufacturers operating at any significant scale. Yet the quality and accuracy of OEE measurement varies enormously — from rigorously measured, machine-level continuous monitoring to weekly estimates compiled from supervisor recollections.
1.2 The Two Versions of OEE in Indian Manufacturing In practice, most Indian manufacturers are running one of two versions of OEE:
*Version A — Reported OEE:* The figure presented in the weekly or monthly management review. Calculated from shift reports, compiled by supervisors, reviewed by plant management, and presented as the performance indicator for the period. This figure is the basis for most benchmarking discussions and most improvement target-setting.
*Version B — Actual OEE:* The figure that emerges when machine-level, real-time, at-source data capture is implemented. This figure is consistently lower than Reported OEE — by amounts that vary by operation type, workforce discipline, and the care with which the manual reporting process is conducted.
Understanding the gap between these two versions — and why it exists — is the starting point for any meaningful OEE improvement programme.
1.3 What Micraft's Implementation Data Reveals Across Micraft MES implementations, the pattern of OEE measurement revision on go-live is consistent: manufacturers who believed their OEE was in the 75 to 85% range, based on manually compiled reporting, typically find it to be in the 60 to 75% range when measured from real-time production data in the first weeks of MES operation.
The initial response to this finding is often to question the accuracy of the new system. The consistency of the pattern across different industries, different plant configurations, and different operating cultures suggests otherwise. The gap is real, it is systematic, and it is explained by the structural limitations of manual data collection that this paper examines.
2. Understanding OEE — The Formula and Its Six Loss Categories
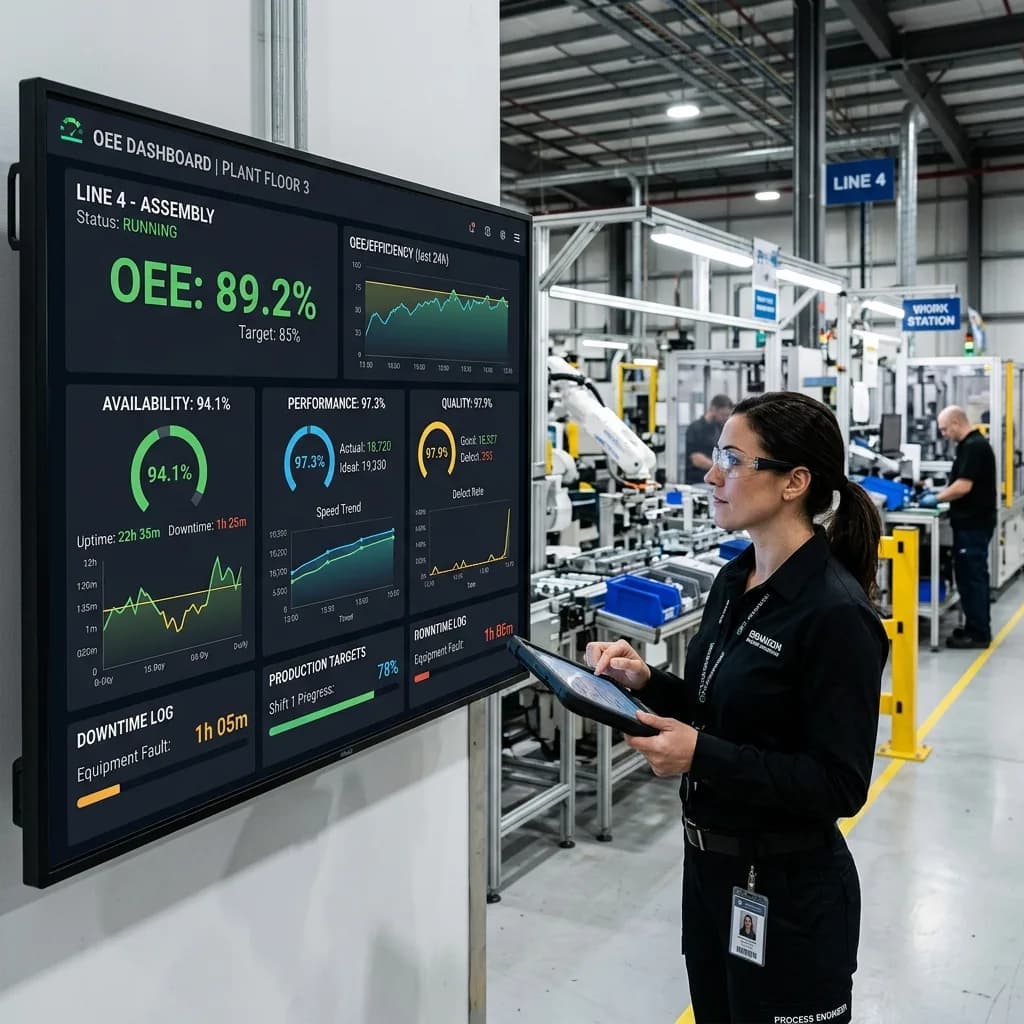
2.1 The OEE Formula OEE = Availability × Performance × Quality
All three components are expressed as a percentage. The overall OEE figure represents the percentage of planned production time that generates good output at full theoretical speed.
*Availability* measures the proportion of planned production time during which the machine is actually running. Calculated as: Actual Run Time ÷ Planned Production Time. *Performance* measures how close to its theoretical maximum rate the machine ran during actual running time. Calculated as: (Ideal Cycle Time × Total Count) ÷ Actual Run Time. *Quality* measures the proportion of total output that meets quality specifications on the first pass, without rework or rejection. Calculated as: Good Count ÷ Total Count.
A world-class OEE benchmark of 85% — the figure commonly cited in manufacturing improvement literature — represents a system achieving approximately 90% availability, 95% performance, and 99.9% quality. In practice, most manufacturers are well below this benchmark, and the realistic improvement targets for most operations are more modest.
2.2 The Six Big Losses Framework The TPM framework that underlies OEE measurement identifies six categories of loss that reduce overall effectiveness — two for each of the three OEE components:
*Availability Losses:* Loss 1 — Equipment failures: Unplanned breakdowns and stoppages — the most visible category of loss. A machine that was running and stops unexpectedly. Loss 2 — Setup and adjustments: Time spent setting up, adjusting, and warming up after changeovers, maintenance events, or shift starts — before consistent production is achieved.
*Performance Losses:* Loss 3 — Minor stoppages and idling: Brief interruptions below the threshold for formal downtime recording — typically defined as stoppages under 10 minutes. The machine stops momentarily for a jam, a feed problem, a sensor trigger, and then restarts. Each event is short; the cumulative effect across a shift is significant. Loss 4 — Reduced speed: The machine running below its theoretical maximum speed — whether by operator adjustment, product requirement, or the degradation of machine condition that reduces sustainable throughput.
*Quality Losses:* Loss 5 — Process defects: Defective output produced during stable production conditions — the rejection or rework that occurs not as a startup phenomenon but as a steady-state quality condition. Loss 6 — Reduced yield / startup losses: Defective output produced during startup, changeover, or adjustment periods — before the process reaches stable production conditions.
The Six Big Losses framework is valuable not just as a classification system but as a direction of investigation. Different loss profiles point to different root causes and different improvement strategies.
3. The Measurement Gap — Why Manual OEE Understates Losses
3.1 The Structural Limitations of Manual Recording Manual OEE recording — the collection and compilation of production data through operator logs, supervisor reports, and end-of-shift summaries — has three systematic biases that consistently produce an overstated OEE figure.
3.2 The Minor Stoppage Invisibility Problem Minor stoppages — the brief interruptions that constitute Loss 3 in the Six Big Losses framework — are the category most severely undercounted in manual recording systems.
The reason is practical: a 3-minute stoppage is too brief to trigger a formal maintenance call. Too disruptive in the moment to prompt careful recording. Too forgettable by the end of a shift to appear in a supervisor's mental summary. And too common — occurring multiple times per hour on many operations — to be individually tracked by a supervisor covering multiple lines.
Yet minor stoppages account for a significant proportion of actual production losses. On a machining line running 480 productive minutes per shift, ten 3-minute stoppages represent a 6.25% availability loss — before a single formal breakdown is recorded. Across 250 shifts per year, this is approximately 7,500 minutes of lost production that does not appear in the manual downtime record.
When Micraft MES is implemented with machine interface connectivity capturing every start/stop event, the minor stoppage data that emerges is consistently larger than the manually reported figure — often 2 to 3 times larger for operations involving manual material feed, operator-dependent machine loading, or process conditions that generate sensor-triggered interruptions.
3.3 The Performance Estimation Problem Performance measurement in manual systems depends on comparing actual output to standard output for the period. This comparison is straightforward when both figures are accurately known — and problematic when either is estimated.
Standard output (the ideal cycle time against which actual performance is measured) is frequently set at the time of the initial production standard and not revised when machine condition changes, when product variation is introduced, or when operator skill level affects the sustainable pace. An outdated standard can create the appearance of strong performance even when the machine is running significantly below its actual capability.
Actual output counting is also subject to rounding — a supervisor's end-of-shift summary of 1,180 units "approximately" rather than 1,187 units from a continuous counter introduces small but systematic errors that accumulate over time.
The combination of these factors means that manually calculated performance is typically 2 to 5 percentage points higher than performance calculated from continuous, at-source data capture.
3.4 The Rework Invisibility Problem First-pass quality — the proportion of output meeting specification without rework — is the denominator of OEE quality calculation. In practice, rework is frequently excluded from quality OEE calculations in manual systems.
The process: a unit fails an inline quality check. The operator sets it aside for rework. The rework technician corrects the defect. The unit passes re-inspection. It enters the finished goods count. In the end-of-shift report, it is counted as a good unit — because by the time the report is compiled, it is a good unit.
The unit should have been counted as a quality OEE loss — the first-pass quality check failed. The rework cost has been incurred. The time spent on rework has been charged to labour. But the OEE quality figure does not reflect this loss.
For operations with significant rework rates — common in casting, forging, machining, and assembly operations with tight tolerances — this exclusion can represent 2 to 4 percentage points of understated quality loss.
3.5 The Cumulative Effect The three biases compound rather than add. A 5-percentage-point understatement of availability losses, combined with a 3-percentage-point understatement of performance losses and a 3-percentage-point understatement of quality losses, produces an OEE overstatement of approximately 10 to 15 percentage points — consistent with the pattern observed in Micraft MES implementations.
4. Where Production Losses Actually Occur
4.1 Loss Distribution in Indian Discrete Manufacturing Analysis of OEE loss data from Micraft MES implementations in Indian discrete manufacturing environments reveals a consistent pattern in loss distribution:
*Availability losses* (equipment failures + setup and adjustments) account for 40 to 55% of total OEE losses in most discrete manufacturing environments. Equipment failures typically represent the larger portion — 30 to 40% of total losses — with setup and adjustment losses representing 10 to 15%.
*Performance losses* (minor stoppages + reduced speed) account for 30 to 45% of total losses. For operations with significant manual loading or operator-dependent process steps, minor stoppages are often the larger performance loss category. For heavily automated lines, reduced speed from machine condition degradation is frequently more significant.
*Quality losses* account for 10 to 20% of total losses in most discrete manufacturing environments, though this varies significantly by process type. Machining operations typically show lower quality OEE losses than casting, moulding, or welding operations.
4.2 The 80/20 of OEE Loss — Implications for Improvement Strategy The loss distribution data leads to a practical implication: for the majority of Indian discrete manufacturers, improvement initiatives focused on two categories — unplanned equipment failures and minor stoppages — will address 60 to 70% of achievable OEE improvement.
This concentration of improvement opportunity in two categories should direct the allocation of improvement effort. A manufacturer investing equal resources in all six loss categories will achieve slower improvement than one that concentrates on the two highest-loss categories first.
4.3 The Equipment Failure Analysis — What Indian Manufacturers Find When at-source downtime capture is implemented and the resulting data is analysed, Indian manufacturers consistently find that:
*A small number of assets account for a disproportionate share of downtime.* In most manufacturing environments, 20 to 30% of machines account for 70 to 80% of total downtime hours. Improvement effort concentrated on these assets produces the most significant OEE uplift.
*Failure reason codes reveal maintenance system weaknesses.* The most common top-three failure categories in Micraft's implementation data are: mechanical failures attributable to inadequate lubrication or cleaning (CLIT failures), tooling and consumable failures attributable to extended tool life beyond recommended replacement intervals, and electrical and control system failures attributable to the operating environment (dust, heat, vibration exposure).
*Maintenance-induced failures are more common than expected.* Failures that occur within 24 to 48 hours of a maintenance event — attributable to incorrect reassembly, disturbed connections, or components not properly secured after maintenance — account for 10 to 20% of equipment failure events in environments without structured post-maintenance verification.
5. The MES Implementation Variable
5.1 Why Deployment Speed Determines ROI The return on investment from an MES implementation is a function of two variables: the magnitude of the OEE improvement achieved, and the time taken to achieve it. Both variables are significantly influenced by how quickly the system is deployed and how completely operators adopt it.
An MES that takes 12 months to deploy begins generating improvement data at month 13. An MES that deploys in 45 days begins generating improvement data at week 7. The cumulative value of improvement over a 24-month period is dramatically different between these two scenarios — and it is driven by deployment speed, not feature sophistication.
5.2 The Adoption Quality Problem Deployment speed alone does not determine outcomes. A system deployed quickly with poor operator adoption produces incomplete data — and incomplete data produces unreliable OEE, which produces the same decision-making environment as the manual system the MES replaced.
The critical adoption metric is downtime capture rate — the percentage of downtime events that are recorded with a specific reason code rather than a generic or no reason. An adoption rate below 80% means that 20% of downtime is classified as unknown — and the root cause analysis that should drive maintenance improvement is working from an incomplete dataset.
5.3 The First 30 Days Determine the Programme Experience across Micraft MES implementations consistently shows that the quality of the programme at 6 months is largely determined by what happens in the first 30 days. Specifically: whether supervisors use the live OEE data during the shift to make decisions (rather than waiting for the end-of-shift report), and whether maintenance teams investigate downtime patterns from the system data within weeks of go-live rather than months.
Plants where supervisors start acting on live OEE data in the first two weeks see significantly better improvement outcomes at 6 months than plants where the system data is ignored during the shift and reviewed retrospectively. The data infrastructure provided by the MES is necessary but not sufficient — the operational culture that uses real-time data for real-time decisions is the differentiating variable.
6. A Framework for Sustainable OEE Improvement
6.1 The Four-Phase Model Based on Micraft's implementation experience, sustainable OEE improvement follows a consistent four-phase trajectory:
*Phase 1 — Measurement Accuracy (Months 1-2)* Establish accurate baseline OEE from at-source, real-time data. Accept that the measured figure will likely be lower than the previous reported figure. Validate measurement accuracy by cross-checking against physical output counts and maintenance records. Achieve >85% downtime capture rate.
*Phase 2 — Pattern Analysis (Months 2-4)* Identify the top two or three assets by total downtime hours. For each asset, identify the top two or three reason codes by frequency and by total hours. Classify failures by pattern type (time-based, random, maintenance-induced) to direct the appropriate intervention.
*Phase 3 — Targeted Intervention (Months 3-6)* Design and implement targeted improvements for the identified high-loss assets and failure categories. For time-based failures: revise preventive maintenance intervals based on actual MTBF data. For maintenance-induced failures: implement post-maintenance verification checklists. For minor stoppage patterns: investigate and modify process or material conditions generating the stoppages.
*Phase 4 — Continuous Improvement (Month 6 onwards)* Verify improvement in OEE data. Repeat the pattern analysis for the next priority. Implement predictive maintenance for assets with detectable failure precursors. Extend the improvement process systematically through the asset base.
6.2 The Role of Predictive Maintenance Predictive maintenance — using condition monitoring data to predict failures before they occur — is the next level of advancement beyond preventive maintenance. It is appropriate for assets where: • The failure mode produces detectable precursor signals (vibration, temperature, current draw) • The lead time from detectable precursor to failure is sufficient for planned intervention • The asset's criticality justifies the investment in monitoring infrastructure
For the majority of assets in Indian discrete manufacturing, the more immediate opportunity is accurate measurement and targeted preventive maintenance rather than predictive maintenance. Predictive maintenance delivers the most value as an incremental enhancement to an already functional OEE improvement programme.
7. Benchmarks and Performance Targets
7.1 Global and Indian Benchmarks The commonly cited world-class OEE benchmark of 85% is an aspirational target for mature manufacturing operations with sustained TPM programmes. It is not an appropriate first-year improvement target for most Indian manufacturers.
More useful benchmarks for Indian manufacturing context:
- Automotive machining (Tier 1/2): Typical Reported OEE (Manual) 75-82% | Typical Actual OEE (Real-time) 62-70% | Realistic 12-Month Target 68-76% - General engineering/fabrication: Typical Reported OEE (Manual) 68-76% | Typical Actual OEE (Real-time) 58-66% | Realistic 12-Month Target 64-72% - Pharmaceutical manufacturing: Typical Reported OEE (Manual) 72-80% | Typical Actual OEE (Real-time) 64-72% | Realistic 12-Month Target 70-78% - Plastics and rubber processing: Typical Reported OEE (Manual) 65-74% | Typical Actual OEE (Real-time) 58-66% | Realistic 12-Month Target 63-70% - Electronics assembly: Typical Reported OEE (Manual) 78-85% | Typical Actual OEE (Real-time) 70-78% | Realistic 12-Month Target 75-82%
*Note: These are indicative ranges based on Micraft's implementation experience and are not representative of all businesses in these categories. Individual results vary significantly based on asset age, maintenance history, product mix, and operator skill.*
7.2 Interpreting OEE Benchmarks OEE benchmarks are most useful as directional indicators rather than absolute targets. The most important benchmark for any manufacturer is their own historical performance, measured accurately and consistently over time.
An OEE that is improving — from 62% to 68% to 74% over three years of consistent focus — is a stronger performance indicator than an OEE that is reported as 80% but calculated from data that is not trusted by the people generating it.
8. Conclusion
The OEE measurement gap in Indian manufacturing is not a minor technical issue — it is a fundamental obstacle to effective production improvement. Manufacturers who believe their OEE is 78% when it is actually 65% are calibrating their improvement targets, maintenance investments, and capacity planning decisions against an incorrect baseline.
The path to closing this gap is not complex. It requires accurate measurement — from real-time, at-source data capture rather than manual compilation. It requires analysis — of where losses actually occur rather than where they are assumed to occur. And it requires a management culture that uses live operational data for in-shift decisions rather than waiting for compiled reports that arrive after the opportunity to act has passed.
The technology infrastructure required for accurate OEE measurement — MES platforms with shop floor data capture, machine interface connectivity, and real-time dashboards — is more accessible and faster to deploy than it has ever been. The return on investment from the operational improvements that accurate measurement enables is well-documented.
The manufacturers who achieve 20 to 40% reductions in unplanned downtime and 25 to 30% improvements in production efficiency are not manufacturers with more sophisticated technology than their peers. They are manufacturers who measured accurately, analysed systematically, and acted on data rather than assumption.